In September 2026 the median registered residential sale in Dubai was 326,711 US dollars. That is 8.3 per cent above August. In the same month the median price per square foot fell 1.2 per cent, from 465.07 dollars to 459.41 dollars.
Both numbers come from the same 9,608 sales. They point in opposite directions because they measure different things. The median sale price went up because the typical unit sold got bigger. The median floor area rose from 729.5 square feet in August to 758.4 square feet in September, a gain of 4.0 per cent. Buyers bought more space at a slightly lower rate per foot.
Almost every headline you will read about Dubai last month reports the first number and not the second. Here is the month as the register actually records it.
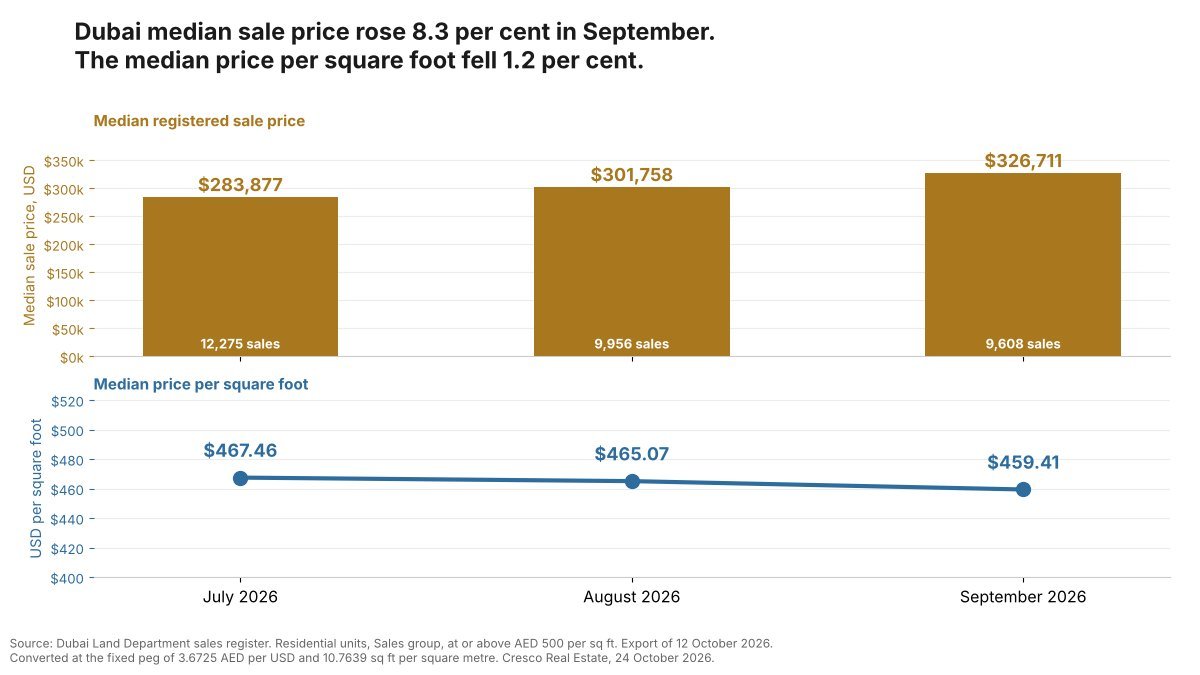
September 2026 against August 2026
| Measure | August 2026 | September 2026 | Change |
|---|---|---|---|
| Residential unit sales | 9,956 | 9,608 | Down 3.5 per cent |
| Median sale price | $301,758 | $326,711 | Up 8.3 per cent |
| Median price per square foot | $465.07 | $459.41 | Down 1.2 per cent |
| Median floor area | 729.5 sq ft | 758.4 sq ft | Up 4.0 per cent |
| Off plan share of sales | 73.9 per cent | 71.5 per cent | Down 2.5 points |
The wider month looked like this. The register recorded 16,339 property registrations of every kind in September. Of those, 11,290 were sales across all property types, worth 8.02 billion dollars. Narrowing to the basis this page uses, residential units only, gives 9,608 sales worth 4.62 billion dollars. The mean sale was 480,720 dollars, well above the median, which is what you expect when a small number of very large deals sit at the top. Freehold accounted for 96.9 per cent of sales.
Why the median rose while the square foot price fell
Two things moved at once.
The first is size. The median unit gained about 29 square feet between August and September. On a median rate of roughly 460 dollars a foot that alone is worth something close to 13,000 dollars on the median price.
The second is the off plan share. Off plan units sell at a clear premium per square foot in Dubai, and they fell from 73.9 per cent of sales in August to 71.5 per cent in September. That is the third consecutive monthly fall. In July the off plan share was 76.0 per cent. A shrinking off plan share pulls the blended price per square foot down even if nothing else changes.
Taken together the register is not showing a 8.3 per cent price rise. It is showing a mix shift. Anyone quoting the median alone is describing what sold, not what things cost.
Apartments by bedroom count
These are the 8,804 apartment sales in the September standard set.
| Type | Sales | Median per sq ft | Median price |
|---|---|---|---|
| Studio | 2,743 | $453.68 | $176,719 |
| 1 bedroom | 3,605 | $445.37 | $333,560 |
| 2 bedroom | 1,900 | $456.39 | $569,095 |
| 3 bedroom | 473 | $516.19 | $986,461 |
| 4 bedroom | 78 | $723.86 | $1,983,662 |
The curve is flatter than most buyers expect. A studio and a two bedroom trade within three dollars a square foot of each other. The step up only arrives at three bedrooms and then sharply at four, where supply is thin and the 78 sales that month are too few to lean on.
Like for like, August against September
If the mix explanation is right then prices inside each segment should be close to flat. They are.
| Segment | August per sq ft | September per sq ft | Change |
|---|---|---|---|
| Studio | $476.83 | $453.68 | Down 4.9 per cent |
| 1 bedroom | $436.24 | $445.37 | Up 2.1 per cent |
| 2 bedroom | $447.78 | $456.39 | Up 1.9 per cent |
| 3 bedroom | $521.08 | $516.19 | Down 0.9 per cent |
| Off plan apartments | $473.31 | $468.68 | Down 1.0 per cent |
| Ready apartments | $383.10 | $374.26 | Down 2.3 per cent |
Not one segment moved anything like 8.3 per cent. Four of the six fell. That is the test of the mix argument and the mix argument passes it.
Off plan still carries a premium
Across all residential units in the standard set, off plan sold at a median 474.97 dollars per square foot in September against 387.23 dollars for ready stock. That is a premium of 22.7 per cent. Looking at apartments only, off plan ran at 468.68 dollars against 374.26 dollars ready, a premium of 25.2 per cent.
The premium widened slightly from August, when the apartment premium was 23.5 per cent. It widened because ready apartments fell faster than off plan ones, not because off plan rose. Both fell.
The top of the market
Dubai luxury starts at AED 10 million, which at the fixed peg is 2,722,941 dollars. In September 105 residential unit sales cleared that line. They were 1.1 per cent of sales by count and 12.7 per cent of value, 587.0 million dollars in all.
The largest single residential unit sale in the register that month was 71,241,800 dirhams, or 19,398,720 dollars. It was a five bedroom off plan unit of 1,088.03 square metres at Como Residences on Palm Jumeirah.
Where the apartments sold
The ten districts with the most apartment sales in September, by count.
| District | Sales | Median per sq ft | Median price | Off plan share |
|---|---|---|---|---|
| Jumeirah Village Circle | 763 | $382.63 | $258,679 | 55.3 per cent |
| Madinat Al Mataar | 600 | $464.90 | $198,795 | 100 per cent |
| Majan | 521 | $382.28 | $176,991 | 93.1 per cent |
| Business Bay | 309 | $547.19 | $519,809 | 34.0 per cent |
| Dubai Land Residence Complex | 308 | $357.25 | $204,396 | 78.6 per cent |
| City of Arabia | 300 | $472.79 | $347,175 | 99.0 per cent |
| Al Khairan First | 294 | $706.39 | $624,068 | 100 per cent |
| Jabal Ali Industrial Second | 276 | $474.41 | $203,450 | 100 per cent |
| Al Hebiah First | 252 | $489.05 | $228,863 | 100 per cent |
| Arjan | 216 | $416.25 | $268,064 | 62.5 per cent |
Five of the ten were entirely off plan. That is the launch pipeline, not a resale market, and the price per square foot in those districts is a developer price list rather than a market clearing price. Business Bay is the opposite case, a third off plan and the second dearest per foot on the list, which is roughly what an established district with real resale depth looks like.
Method and limits
The source is the Dubai Land Department public sales register, taken from the export dated 12 October 2026, filtered to transactions dated 1 to 30 September 2026. All thirty days of the month are present.
The basis for every headline figure is the site standard: transaction group Sales, usage Residential, property type Unit, at or above AED 500 per square foot. The screen removed 13 of 9,621 sales, or 0.14 per cent, which is why it changes almost nothing this month. Dirhams are converted at the fixed peg of 3.6725 to the dollar. Areas are converted at 10.7639 square feet per square metre. All central figures are medians unless the text says mean.
The basis changed from the previous edition of this page. The August 2026 edition reported an unscreened figure across all property types, which gave a median of 330,255 dollars on 11,600 sales. On that same unscreened basis September was 362,151 dollars on 11,290 sales worth 8.02 billion dollars. Both bases show a rise. The screened basis used here is the one our monthly series uses, so the month on month numbers in the table above are like for like and the comparison with the previous version of this page is not.
The register is revised after publication. August was exported two days after month end and September twelve days after, so September is the more settled read of the two. If anything that understates the fall in transaction count, because the less settled month is the one showing the higher number.
We could not obtain a fresher export. The Dubai Land Department open data form requires a captcha, so this page uses the most recent export already held rather than a same day pull. A second September export would let us measure the revision directly and we have not done that.
The register uses its own district names and large master communities are split across several of them, so district counts are not the same as the names used in marketing. Figures are completed and registered transaction values. They are not asking prices and they are not valuations. A single month reflects which projects released stock that month as much as it reflects demand.
This is market information. It is not investment, legal or tax advice.
Frequently asked questions
Did Dubai property get 8.3 per cent more expensive in September 2026?
No. The median registered sale rose 8.3 per cent, but the median price per square foot fell 1.2 per cent and four of six like for like segments fell. The median moved because the typical unit sold was about 4 per cent larger and because fewer of the sales were off plan.
What does a studio apartment cost in Dubai in dollars?
The median studio sale registered in September 2026 was 176,719 dollars, at a median of 453.68 dollars per square foot, across 2,743 sales.
Is off plan more expensive than ready property in Dubai?
Per square foot, yes. In September 2026 off plan apartments ran at a median 468.68 dollars per square foot against 374.26 dollars for ready apartments, a premium of 25.2 per cent.
How much is a luxury property in Dubai?
Luxury here means AED 10 million and above, which is 2,722,941 dollars at the peg. In September 2026 there were 105 such residential unit sales, 1.1 per cent of sales by count and 12.7 per cent of all value.
Are these asking prices or actual sale prices?
Actual registered sale prices from the Dubai Land Department register. No listing or asking price data is used anywhere on this page.
Related reading
For the comparison against American housing see Dubai versus United States home prices per square foot. For what a given budget buys see what 500k buys in Dubai. If you are buying from the United States, start at our guide to buying Dubai property from the USA and check any firm you deal with against our ten broker checks.